This web page was produced as an assignment for Genetics 564, an undergraduate course at UW-Madison
|
Phylogeny
What is gene phylogeny?
Phylogeny is used to study the relatedness between different species as they change through time. When we compare homologous genes we can infer evolutionary relationships based on similarities and differences between DNA sequences. Phylogenetic trees can then be constructed and used to display these similarities. There are many methods used to construct a phylogenetic tree: The first step is to compare and determine the amount of similarity between sequences. BLOSUM Matrix and Percent Identify are two methods used compare gene sequences. BLOSUM Matrix BLOSUM matrices calculate similarities between two gene sequences. A sequence alignment is generated and used to score nucleotides. At each position in the sequence the nucleotides are compared to one another and given a scored based on the likelihood they would occur again by chance. Scores at each site are summed and totaled; the higher the score, the more closely related the species [1]. Try BLOSUM62 yourself here. Percent Identity Percent identity calculates similarities between two gene sequences. A sequence alignment is generated and used to determine the percentage of nucleotides throughout both sequences that are identical in both residue and position [2]. The second step is to draw a tree using the information gathered from the sequences. Neighbor Joining and Average Distance are two methods used to draw phylogenetic trees. Neighbor Joining Neighbor joining constructs phylogenetic trees based on highest degree of relatedness between species. Species that are most closely related are grouped together and joined by a node, representing their common ancestor. Branch lengths are calculated based on the amount of change in sequence between the diverged species and its common ancestor [3]. Average Distance Average distance constructs phylogenetic trees based on highest degree of relatedness between species. Species that are most closely related are grouped together and joined by a node, representing their common ancestor. Branches between species possessing a common ancestor are equal in length, assuming equal divergence from the common ancestor, and therefore, equal rates of mutation between the sequences [3]. |
Click phylogenetic trees to enlarge
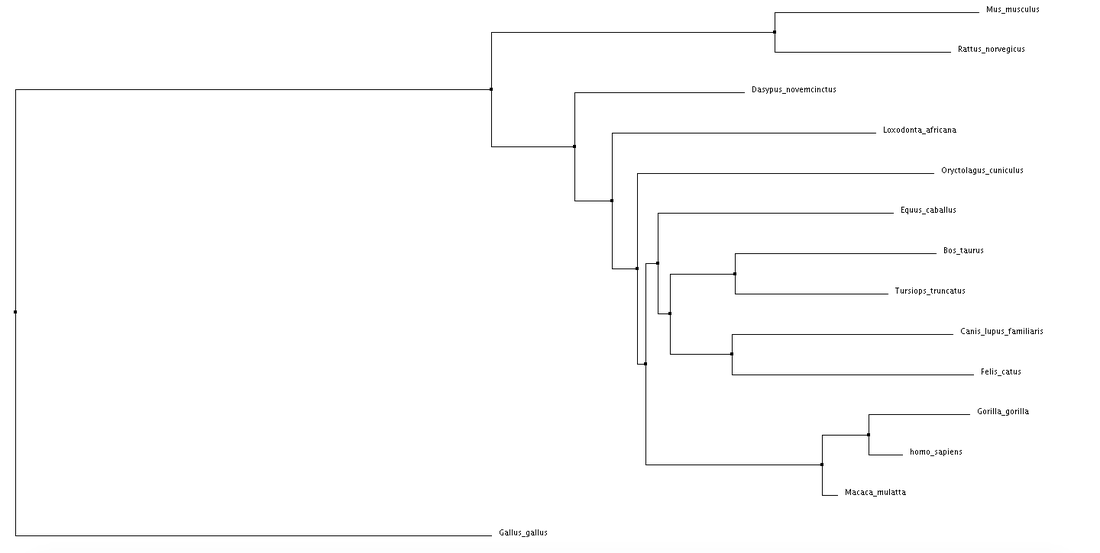
Neighbor Joining using Percent Identity for the NBN gene.
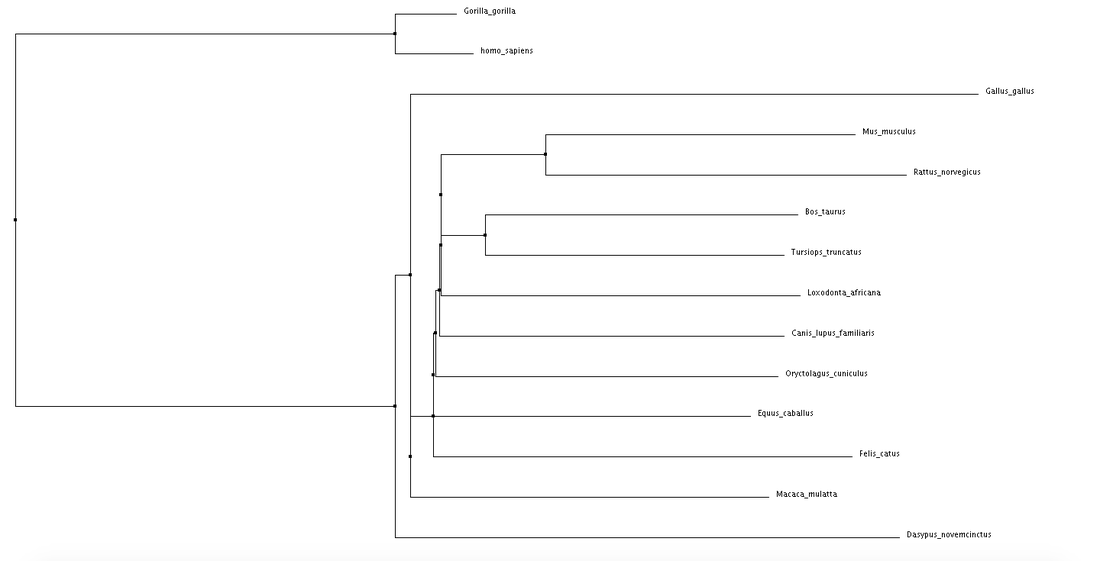
Neighbor Joining using BLOSUM62 for the NBN gene.
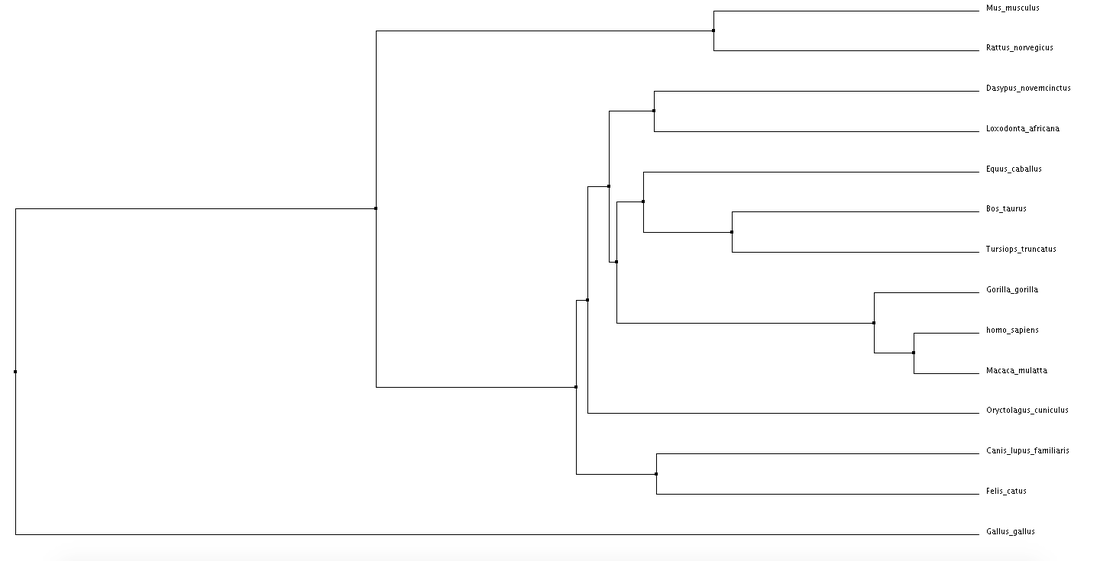
Average Distance using Percent Identity for the NBN gene.
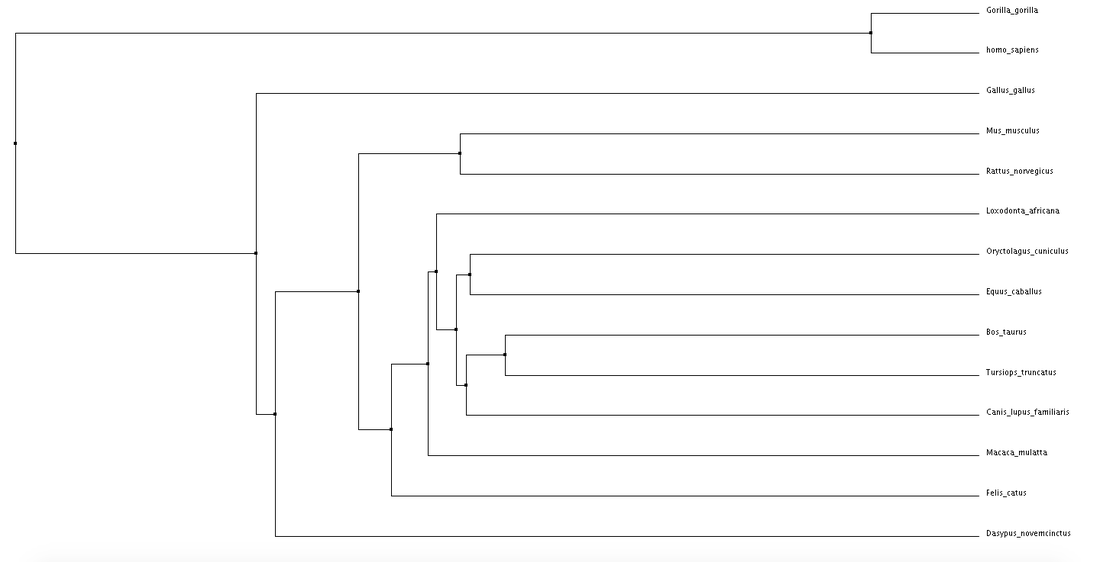
Average Distance using BLOSUM62 for the NBN gene.
|
Discussion
|
Both average distance and neighbor joining methods produced fairly similar trees in regards to the NBN gene. Branching patterns, indicating evolutionary relationships between the various species, are largely identical across all trees. Not surprisingly, Gallus gallus (chicken), the only non-mammal, is shown to be most distantly related to all other species. This relationship remains consistent across all four trees. Although a relatively high conservation among all mammals, highest sequence similarities are seen among primates, especially in trees using percent identity sequence comparisons.
The high conservation depicted in these trees suggests a potential for model organisms. Although most distantly related, the chicken may serve as a human model for NBN gene related research. Even more closely related we see Mus musculus (mouse), and Rattus norvegicus (rat). The ability to use these organisms for research surrounding NBS drastically improves the chances for the development of various drugs and treatments. |
|
References:
Phylogenetic Trees. Generated using Clustal Omega [1] Where did the BLOSUM62 alignment score matrix come from? Sean R Eddy [2] BLAST Glossary: http://www.ncbi.nlm.nih.gov/books/NBK62051/ [3] Evolution textbook: http://evolution-textbook.org/content/free/contents/ch27.html#ch27-4-2 |
